Example usage
Here we will demonstrate how to use pycounts to count the words in a text file and plot the top 5 results.
Imports
import pycounts_tt25
from matplotlib import pyplot as plt
Create a text file
We’ll first create a text file to work with using a famous quote from Einstein:
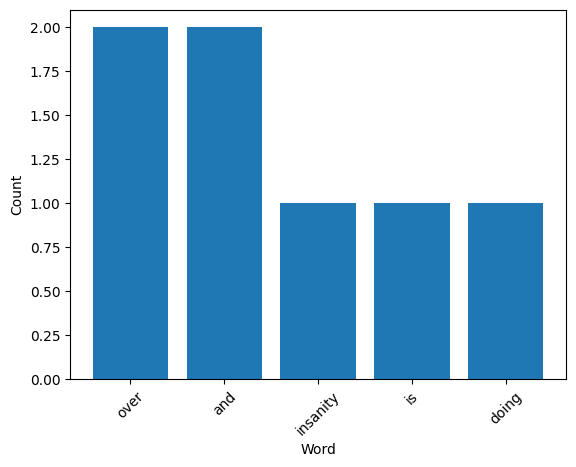
quote = "Insanity is doing the same thing over and over and expecting different results."
with open("einstein.txt", "w") as file:
    file.write(quote)
Count words
We can count the words in our text file using the `count_words()`` function. Note that this function removes punctuation and makes all words lowercase before counting.
counts = pycounts_tt25.count_words("einstein.txt")
print(counts)
Counter({'over': 2, 'and': 2, 'insanity': 1, 'is': 1, 'doing': 1, 'the': 1, 'same': 1, 'thing': 1, 'expecting': 1, 'different': 1, 'results': 1})
Plot words
We can now plot the result using the plot_words() function:
fig = pycounts_tt25.plot_words(counts, n=5)